personal project · 2026

Esports Market Analysis Engine

i like watching professional League of Legends and wanted to study how a completed draft changes a matchup. i built a research app around a CatBoost model that brings champion selections, team and player profiles, market comparisons and prediction tracking into one place.

PythonJavaScriptMachine LearningStatistical ModellingData Visualisation
see what i built
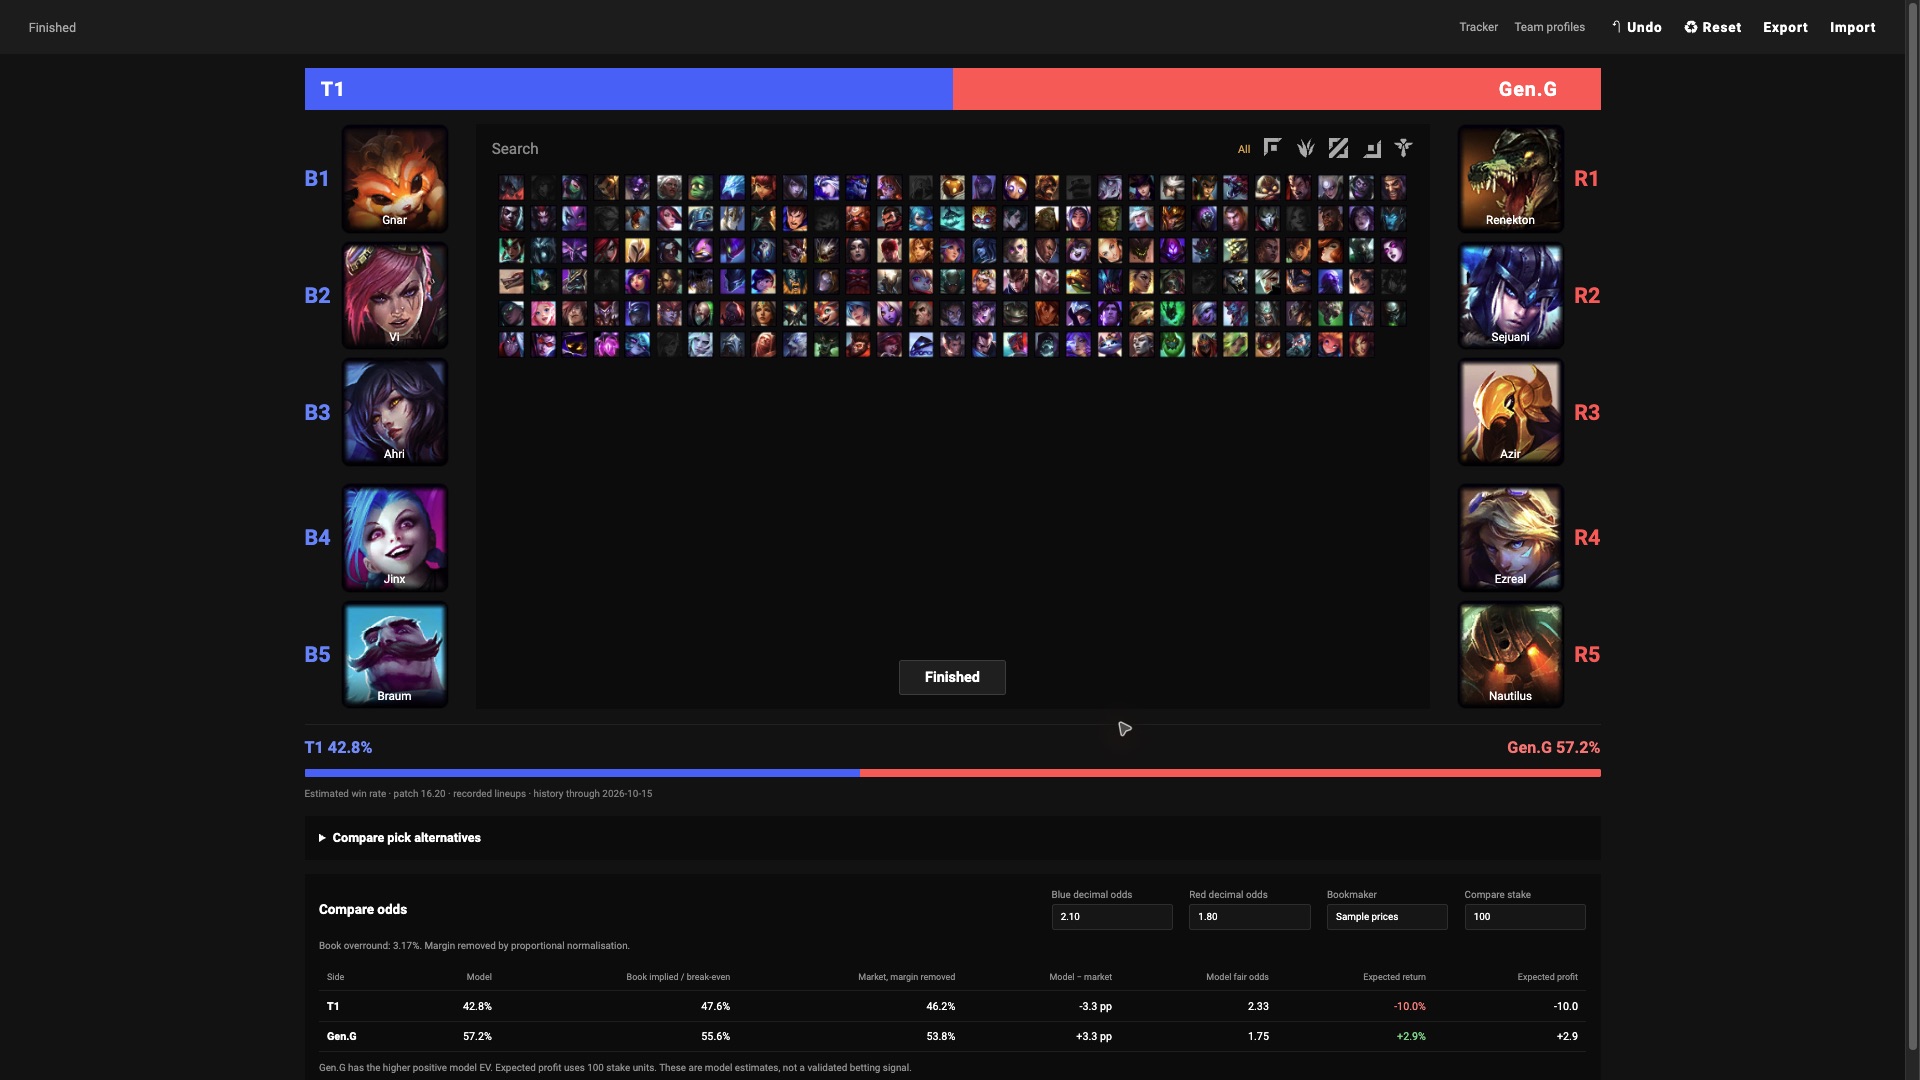
01 / Draft analysisApplication screenshot - example draft
League of Legends draft board with ten champion selections, estimated probabilities for T1 and Gen.G and a sample odds comparison.
Actual interface with an illustrative draft and sample prices. The estimates are not measured results or a historical betting record.

the problem

Predicting which team wins and understanding whether the market prices that outcome accurately are different problems. A strong favourite can still be priced too confidently, and an apparent discrepancy may simply reflect uncertainty or incomplete information.

In League of Legends, each team selects five champions before play begins. This app evaluates those completed selections and keeps the resulting prediction available for review after the match.

what i built

01 - JavaScript

Draft board

Responsibility: Captures two teams and ten role ordered champion picks, then presents the estimate and fixed-nine alternative-pick comparisons.

How it works: Completing a draft reconstructs the model inputs from the frozen browser bundle and runs inference; an alternative-pick check changes one champion while holding the other nine fixed. I used Drafting.gg's interface as a visual reference.
02 - Python

Feature pipeline

Responsibility: Builds pre-match team, player, champion-pool, role-matchup and composition features from historical games.

How it works: Games are processed in time order: the pipeline builds a row from previously available state, saves that row and only then allows the completed result to update future state.

03 - CatBoost + calibration

Probability model

Responsibility: Learns nonlinear relationships between the engineered features and match outcomes, then maps the raw score onto a probability scale.

How it works: The feature vector passes through the exported CatBoost trees to produce a raw score, then a separately fitted logit calibration step converts that score into the displayed probability.

04 - Descriptive analytics

Extrapolated player data

Responsibility: Shows role-aware player percentiles, raw statistics, coverage, champion pools and team history for investigation.

How it works: Prepared historical summaries are filtered by player, role and competition scope, then compared with same-role peers while retaining raw values and missing-data coverage.

05 - SQLite ledger

Prediction tracker

Responsibility: Stores the original prediction before play, accepts the result later and compares model versions on matched predictions.

How it works: Saving creates a timestamped forecast record and model id, settlement appends the outcome later, while reports score only eligible matched records.

06 - Odds arithmetic

Market comparison

Responsibility: Converts manually entered two-sided decimal odds into market probabilities and removes the bookmaker's proportional margin for comparison.

How it works: The interface converts both prices to implied probabilities, normalises their combined margin and places the resulting market view beside the model estimate.

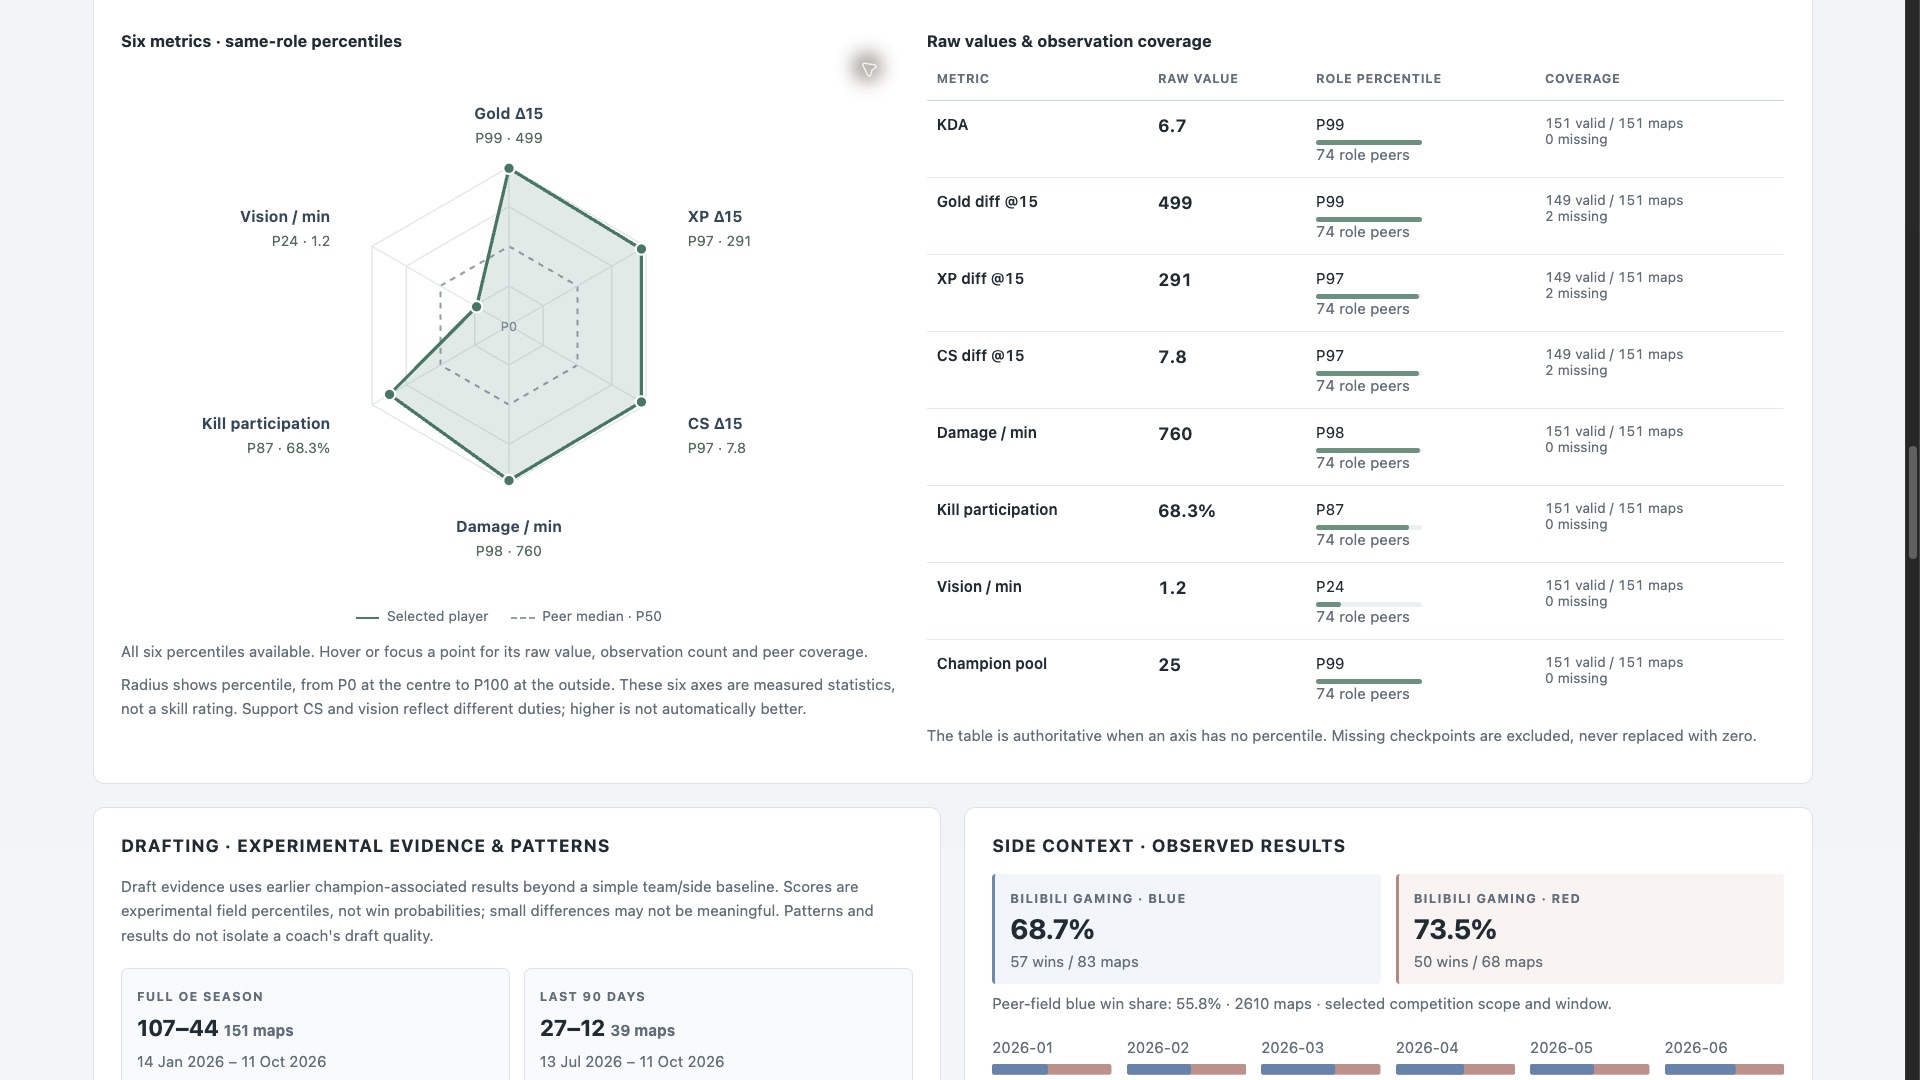
02 / Player profileApplication screenshot - historical snapshot
Player profile radar comparing six same-role performance percentiles beside a table of raw statistics, peer counts and valid or missing observation coverage.
Historical profile view showing role-based percentiles, raw values and missing-map coverage.

engineering decisions

Chronological evaluation instead of a random split

I train on earlier matches, calibrate on a later period and evaluate on later unseen matches because a random split would let future game states influence an earlier prediction task. This leaves fewer recent maps for evaluation, but makes the test closer to how the model would actually be used.

Point in time features instead of corrected present day history

The feature builder reveals each result only after its recorded availability time, and games sharing a timestamp are featured before either result is added. Historical reconstruction becomes more demanding, but it prevents the model from learning with information that was unavailable at prediction time.

Separate calibration instead of trusting raw model scores

CatBoost learns the ranking patterns, while a later held-out period fits the probability mapping. Reserving data for calibration reduces the examples available to the classifier, but a score described as 70% should be evaluated as a probability rather than only as a ranking.

Market odds as a comparison layer

The main model excludes market probability because the historical data does not contain consistent, timestamp-matched two-sided post-draft prices. Manual odds can still provide context, but the missing history means a displayed discrepancy is not evidence of a profitable strategy.

current outcome

A local version connects the statistical research to a browser interface. Draft analysis, profiles, market comparisons and evaluation are implemented, with automated checks around prediction consistency.

Development and evaluation are ongoing. Draft entry and result recording are still manual, and an apparent pricing difference does not establish profitable performance. Time-ordered backtests are being used to compare training windows and evaluation splits.

Rare champion picks and combinations have limited historical support. In those cases the model can fall back toward broader team-strength patterns, so the interface keeps sample support beside alternative-pick comparisons rather than presenting every estimate with equal confidence.

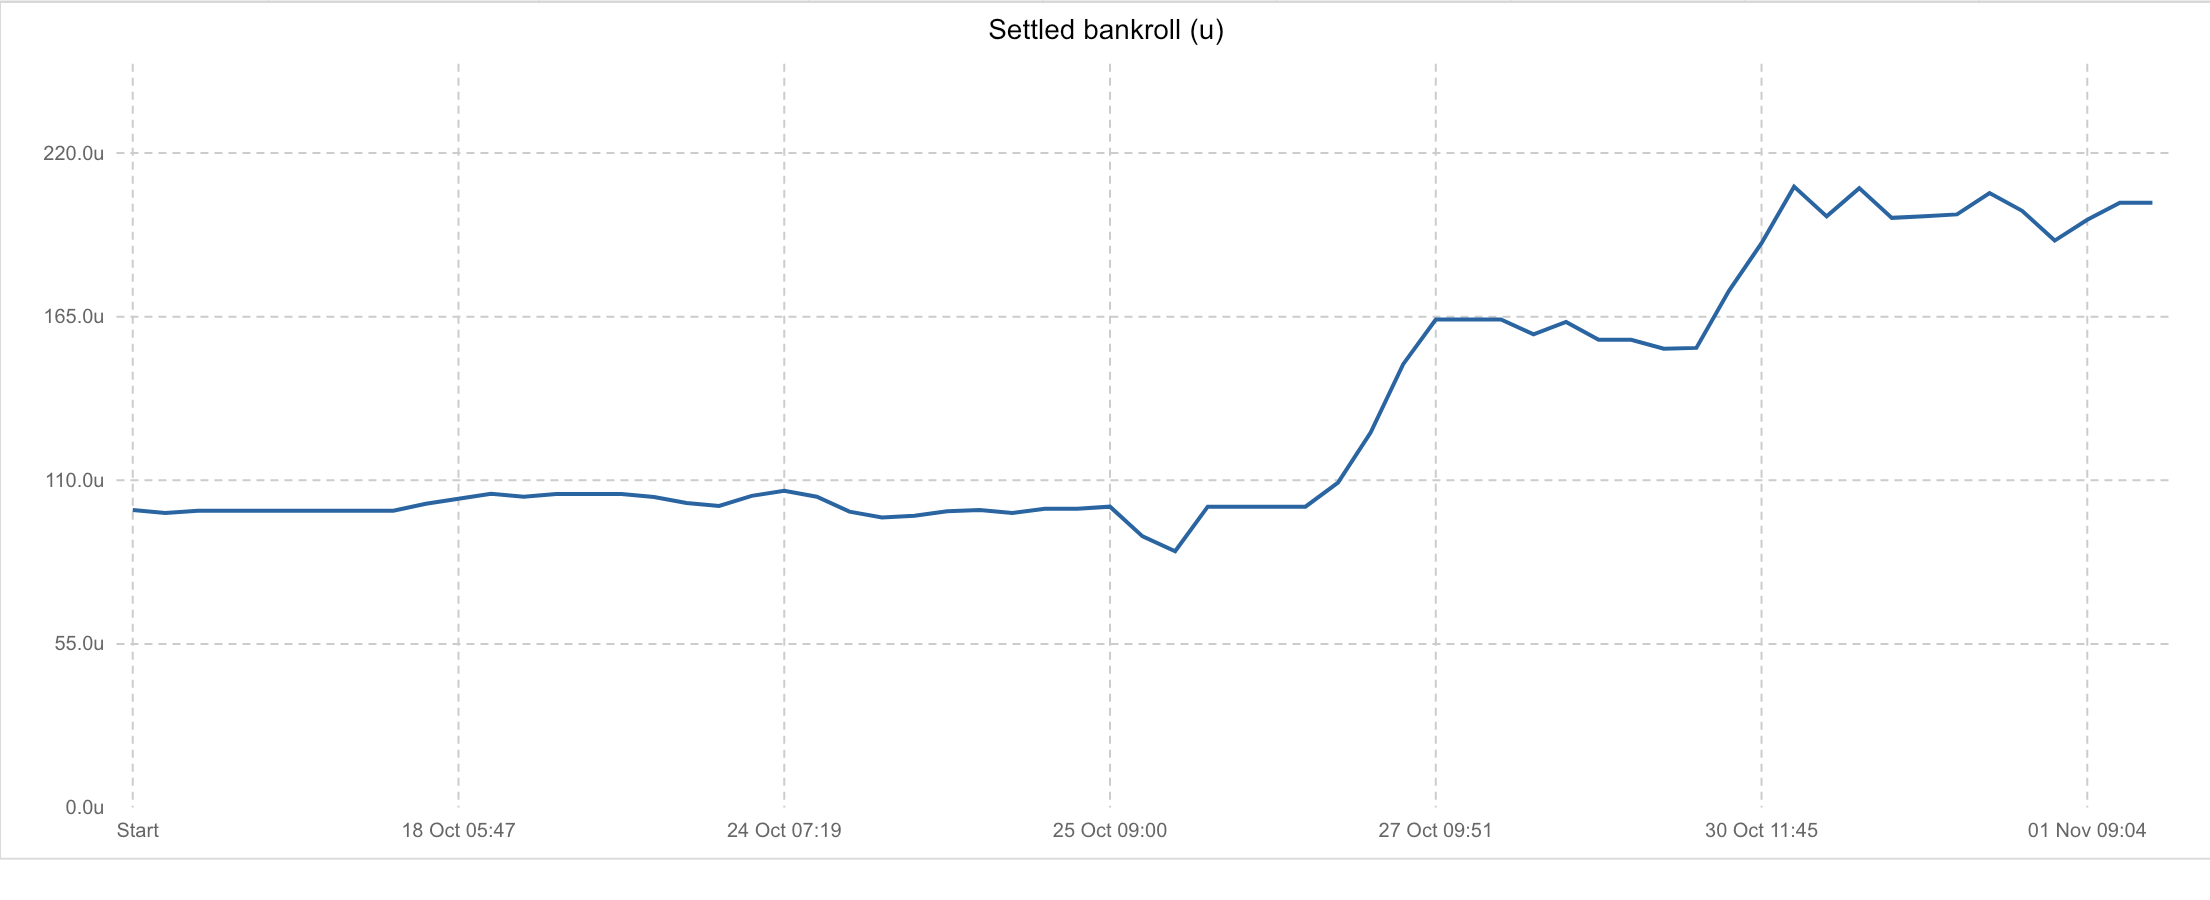
203.32u

settled bankroll

+103.32u

net profit

worlds 2026 play ins to swiss
Line chart of tracked settled bankroll during Worlds 2026, rising from 100 units to 203.32 units
Personal results from a 100u starting bankroll. Biggest win: TL vs AL ml (+23u)

what's nextlast edited ·

  • Continue collecting saved forecasts and results on later, unseen matches.

    date TBC
  • Investigate different historic odds providers to improve training.

    date TBC
  • Improve champion features to account for low sample draft picks without overrelying on team strength.

    date TBC
  • Compare alternative model designs under the same point-in-time evaluation contract.

    date TBC
  • Experiment with neural networks to model draft to better account for low sample draft picks.

    date TBC